Accounts Receivable Turnover Ratio: Formula & Examples
Quick Summary
- AR turnover = net credit sales ÷ average accounts receivable. It tells you how many times a period you collect your average receivables
- A higher number means faster collection. The commonly quoted healthy range is 5 to 10, though the right target depends on your sector and terms
- Turnover in days is 365 divided by the ratio, and it measures the same thing as DSO from the opposite direction
- Use net credit sales and average AR. The common calculation mistakes all push the ratio artificially high, which makes collections look healthier than they are
- The trend matters more than the level. A ratio sliding over several quarters means collection is slowing, whatever the absolute number
- It's a report metric, not an operational lever. Use it to spot a trend, then drop into the aging detail to find the accounts behind it
What is the accounts receivable turnover ratio?
The accounts receivable turnover ratio measures how many times a business collects its average accounts receivable over a period, usually a year. It's an efficiency ratio. A higher ratio means you collect faster and tie up less cash in unpaid invoices.
Think of it as a speedometer for collections. A ratio of 8 means you collected your average receivables balance eight times over the year, or roughly every 45 days. It answers one practical question. How quickly do your credit sales turn into cash?
The accounts receivable turnover formula
The math is simple when you use the right inputs.

AR turnover ratio = net credit sales ÷ average accounts receivable
Use net credit sales and average AR. Total sales and a single point-in-time balance both distort the result, and both are covered in the mistakes section below.
How to calculate average accounts receivable
Average AR smooths out the swings between the start and end of the period.

Average AR = (beginning AR + ending AR) ÷ 2
For a more accurate figure in a seasonal business, average the monthly balances instead of just the two endpoints. A single snapshot can distort the ratio if your AR was unusually high or low on that one day.
A worked example
Say for the year your business records:
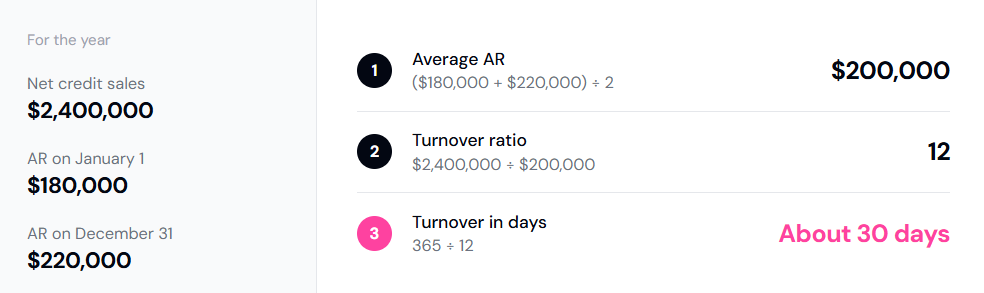
- Net credit sales of $2,400,000
- Accounts receivable on January 1 of $180,000
- Accounts receivable on December 31 of $220,000
First, average AR: (180,000 + 220,000) ÷ 2 = $200,000
Then the ratio: 2,400,000 ÷ 200,000 = 12
You collected your average receivables 12 times over the year. If you bill on net 30 terms, that's a strong result, since it lines up with collecting payments roughly every 30 days.
Accounts receivable turnover in days
The ratio itself is a little abstract. Turning it into days makes it easier to read.
Turnover in days = 365 ÷ turnover ratio
Using the example above, 365 ÷ 12 works out to about 30 days. That's your average collection period, the number of days it takes to get paid.

This is the same idea as days sales outstanding. Turnover in days and DSO measure the same thing, approached from different starting points. Turnover gives you a clean year-over-year view for tracking progress, while DSO is the more familiar day-count most finance teams quote. You can see how it sits alongside the other collection metrics in the AR metrics guide.
What is a good AR turnover ratio?
There's no universal right answer. A ratio that looks great in retail would be a warning sign in construction, so always compare against your own industry and your own history rather than a single target.
That said, the figure most often quoted as healthy sits between 5 and 10. Treat it as a rule of thumb, since nobody publishes the survey behind it, and use the industry table below for a more useful range.
AR turnover by industry
Because turnover in days and DSO are the same measurement inverted, typical turnover ranges follow directly from typical DSO by industry. The ranges below are derived that way, and they carry the same caveat as any industry table: they're orientation, not targets.
The pattern makes sense. Businesses with upfront or subscription billing collect fast, so they sit high. Construction and manufacturing carry project billing, retention, and longer payment cycles, so they sit low. Neither is better. Each reflects how the sector actually sells.
For the DSO ranges these derive from, and the reasons published industry tables disagree with each other, see the collections KPI benchmarks.
What high and low turnover signal
A high ratio usually means efficient collections and sound credit policies. Push it too high, though, and it can signal terms so strict that they cost you sales. There's such a thing as riding your customers harder than the ground requires.
A low ratio suggests slower collections, looser credit terms, or customers who are struggling to pay. It's a prompt to review your process rather than an automatic failure, especially if long terms are normal in your industry.
The move that matters is the trend. A ratio sliding over several quarters tells you collection is slowing, whatever the absolute number.
How to improve your AR turnover ratio
A better ratio comes from collecting faster, and the levers are the same ones that move every other collection metric. The AR metrics guide covers each one and the number it moves, so this section keeps to what's specific to turnover.
Two things move this ratio that don't show up elsewhere.
- The first is the denominator. Average AR falls when cash is applied, not when it arrives, so a cash application backlog holds the ratio down even while customers pay on time.
- The second is the numerator. Net credit sales exclude returns, allowances, and discounts, so a quarter heavy with credit notes drops the ratio for reasons that have nothing to do with collections. Check both before anyone gets blamed.
Beyond those two, the ratio rewards consistency over intensity. A pre-due confirmation on every invoice and a reminder on the day it falls due beat a quarter-end scramble, because they keep invoices inside terms instead of pulling them back from outside.
None of this is exotic. Steady miles beat a hard gallop, and the ratio rewards the team that keeps a pace.
See how Lunos solves this
Of the levers on this list, collections consistency is the one that moves fastest. Lunos AI accounts receivable agents follow up on every invoice, every time, which is how the ratio climbs without a single change to your credit policy.
4 common mistakes when calculating AR turnover
A skewed input produces a ratio that lies to you. Watch for these:
- Including cash sales. Cash transactions never create a receivable, so folding them in inflates the ratio and hides collection problems
- Using gross sales instead of net. Forgetting to remove returns, allowances, and discounts overstates the sales figure
- Using ending AR instead of average. A single point-in-time balance can distort the result, especially in a seasonal book
- Mismatching the periods. Your sales figure and your AR figure have to cover the same window, or the ratio is meaningless
Most of these push the ratio artificially high, which is the dangerous direction, since it makes collections look healthier than they are.
Limitations of the AR turnover ratio
The ratio is useful as a report metric and weak as an operational lever. It tells you something moved. It rarely tells you what to do about it. A few ways it can mislead:
- It hides mix effects. A shift in which customers or segments are buying can move the ratio even when your collection effort hasn't changed
- Timing distorts it. A big sale late in the period can swing the number for reasons that have nothing to do with how well you collect
- The average hides the shape. A single ratio can look fine while masking a bimodal book, where most accounts pay early and a risky tail sits far past due
That last point is the important one. The ratio is a portfolio-level summary, and the problems live at the account level. Use turnover to spot a trend, then drop into the aging detail to find the accounts behind it.
FAQs
How do you calculate accounts receivable turnover?
Divide net credit sales by average accounts receivable. Net credit sales are your credit sales minus returns, allowances, and discounts. Average AR is the beginning balance plus the ending balance, divided by two. The result is how many times you collected your receivables in the period.
What is a good accounts receivable turnover ratio?
The commonly quoted healthy range is 5 to 10, but the right target depends on your sector and terms. Compare against your industry and your own trend.
What does a high accounts receivable turnover ratio mean?
It usually means you collect efficiently and your credit policies are working. A very high ratio can also mean your terms are unusually strict, which is worth checking if it might be costing you sales.
Is AR turnover the same as DSO?
They measure the same thing from opposite directions. DSO counts the average days to collect. Turnover counts how many times you collect your average receivables in a period. Divide 365 by the turnover ratio and you get a figure that lines up with DSO.
A sliding ratio means someone has eased off the pace
Lunos finds where, and fixes it account by account with follow-up that never lapses. Book a demo to see the trend turn.