8 Accounts Receivable Collections KPIs (and How Each One Misleads You)
Quick Summary
- DSO is the number leadership asks for and the weakest scorecard for the team, because it moves with sales timing and seasonality regardless of how well anyone collected
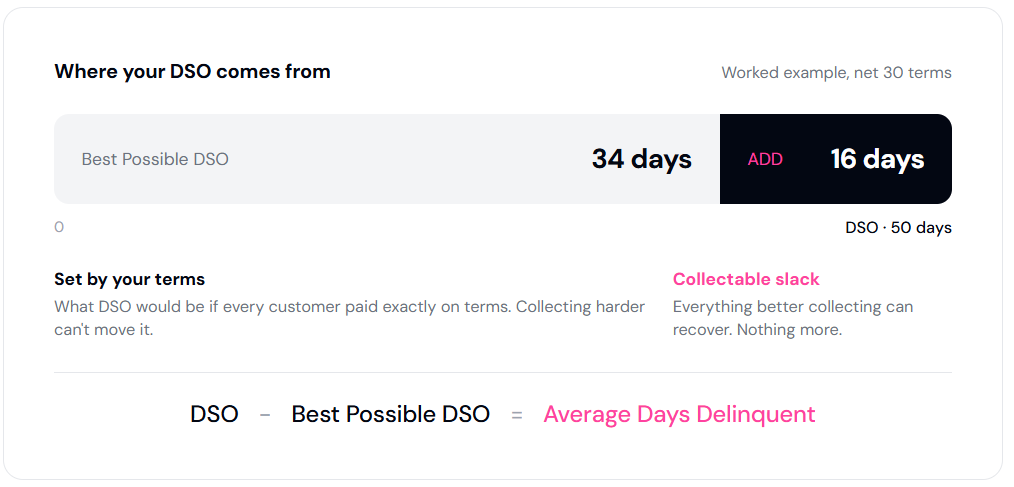
- Measure your DSO against your Best Possible DSO. Everything between the two is recoverable through better collecting, and everything below it's set by your terms
- DSO, BPDSO, and ADD are arithmetically related. Average Days Delinquent is just DSO minus Best Possible DSO
- CEI strips out the sales-timing noise, which makes it the better read on whether the team is doing its job
- Four operational metrics act as an early-warning system: promise-kept rate, right-party-contact rate, dispute rate, and dispute cycle time
- Every metric here lies to you in a specific, predictable way. Knowing how is most of the value
- Published industry DSO tables disagree with each other badly, because they measure different populations. The Credit Research Foundation and Dun & Bradstreet run the surveys worth benchmarking against
Your own trend and your own BPDSO gap will tell you more than any industry table.
The 8 AR collections metrics worth tracking
A short, honest set beats a crowded dashboard. Eight metrics cover it.
1. Days Sales Outstanding (DSO)
Days Sales Outstanding is the average number of days it takes to collect after a sale.
DSO = (accounts receivable ÷ total credit sales) × days in the period
Use net credit sales rather than total revenue. Including cash sales drags the number down and makes collections look better than it is.
What DSO tells you is roughly how long your cash is tied up, which is why leadership asks for it.
The distortion is significant. DSO moves with sales timing, so a heavy late-quarter sales month pushes it up even if collections performance was identical. A strong sales quarter can make a good AR team look worse.
2. Best Possible DSO (BPDSO) and the gap
Best Possible DSO is what your DSO would be if every customer paid exactly on terms.
BPDSO = (current accounts receivable ÷ total credit sales) × days in the period
The number itself is less interesting than the distance from it.
Collectable slack = DSO − Best Possible DSO
Better collecting can recover that portion of your DSO and no more. Everything below it is structural, set by your payment terms rather than your process.
One caution. BPDSO assumes your terms are sensible. A business on net 90 has a comfortable-looking BPDSO and may still have a working capital problem that no amount of collecting will fix.
3. Average Days Delinquent (ADD)
Average Days Delinquent is the average number of days an invoice is paid past its due date. Where DSO measures total collection time, ADD isolates the lateness.
ADD = DSO − Best Possible DSO
That's the same arithmetic as the collectable slack above, which is worth noticing. ADD, DSO, and BPDSO are three views of one relationship rather than three independent metrics.
The distortion here is the average itself. A handful of very large, very late invoices will drag ADD upward and hide a book that's otherwise healthy. Look at the distribution before you react to the mean.
There's no useful public benchmark for ADD, because it moves entirely with your payment terms and customer mix. Read it against your own history.
4. Collections Effectiveness Index (CEI)
Collections Effectiveness Index measures how much of what you could have collected in a period you actually collected, expressed as a percentage.
CEI = [(beginning AR + credit sales − ending total AR) ÷ (beginning AR + credit sales − ending current AR)] × 100
Closer to 100 is better.
CEI is the best available read on team effectiveness because it strips out the sales-timing noise that distorts DSO.
It has two blind spots worth knowing. It's sensitive to the period you pick, so a single large collection landing inside or outside the window swings it. And it says nothing about whether your terms are sane, so a company collecting brilliantly on terrible net 120 terms can post an excellent CEI.
As for what counts as good, the common rule of thumb puts above 85% at excellent, 70 to 84% at workable, and below 70% as a problem. That's industry convention rather than a research finding, and published sources place the "good" line anywhere between 80% and 90%.
5. Percent current and aging buckets
Percent current is the share of receivables that aren't yet past due.
Percent current = current AR ÷ total AR
Aging buckets group the rest by how overdue they are, conventionally 1-30, 31-60, 61-90, and 91-plus days.
Together they tell you where the risk sits today.
The trap is that a healthy percent-current figure can coexist with a small number of large, badly aged balances that are about to become write-offs. Percent current is a volume measure, and write-offs are a value problem. Read the 91-plus bucket separately.
6. Promise-kept rate
The share of payment promises that customers actually keep.
This moves before DSO does, which makes it one of the earliest risk signals available. A customer whose promise-kept rate is sliding is telling you something months before their aging does.
It only measures promises somebody captured. If your team takes verbal commitments and never logs them, the metric flatters you by counting only the ones that were formal enough to record.
7. Right-party-contact rate
How often outreach reaches a person who can actually authorize or process payment.
A low rate points straight at scattered contact data rather than at collector effort. Chapter 4 covers why fragmented contact records under-collect.
Define "right party" tightly before you measure it, otherwise the number drifts to mean "someone replied."
8. Dispute rate and dispute cycle time
Dispute rate is the share of invoices that get disputed. Cycle time is how long they take to clear.
A slow dispute process quietly inflates your past-dues with money that was never really late, which is why cycle time matters more than most teams assume.
This metric has a counterintuitive failure mode. When a team gets better at logging disputes properly, the measured dispute rate goes up. An improving process can look like a deteriorating one for a quarter or two, so read it alongside cycle time rather than alone.
CEI vs DSO: which one measures collections performance?
DSO is the number leadership asks about, so you'll always report it. It's a weak scorecard for the collections team because it moves for reasons the team doesn't control.
A strong sales month or a few large new contracts push DSO around regardless of how well anyone collected.
CEI measures what the team did with what it had.
If you do lean on DSO for performance conversations, use a rolling twelve-month figure. It smooths the seasonal noise and shows the trend rather than the quarter.
DSO benchmarks by industry
Benchmarks are worth less than most people expect, and the reason is worth understanding before you use one.
What is a good DSO?
There's no single right number, because your payment terms set the floor. A few credible figures are worth anchoring on:
- Median DSO sits at roughly 40.5 days, per the Credit Research Foundation's Q4 2025 domestic trade receivables summary
- The gap between top-quartile and median performers is about 18 days, according to The Hackett Group's 2025 US Working Capital Survey of the largest 1,000 nonfinancial public companies. Hackett values that gap at around $600 billion in trapped working capital, making receivables the single largest component of excess working capital. Their European survey found the same 18-day spread
- US DSO has degraded for two consecutive years, per the same Hackett survey, so holding DSO flat is beating the market
- Average US payment terms run about 45 days, with 43% of B2B invoice value overdue, according to the Atradius Payment Practices Barometer for the US in 2025
That 18-day spread is the most useful benchmark in the set. The difference between an average AR function and a strong one is measured in weeks of working capital, on the same book of customers.
Average DSO by industry
The table below is directional. It's compiled from several 2025 and 2026 sources that don't fully agree, and the spread between them is wide enough that these work as orientation rather than targets.
Payment terms, contract length, payer mix, and dispute frequency drive most of that variation. Collections effort drives less of it than the table implies.
Why published DSO tables disagree
Search for average DSO by industry and you'll find a dozen tables that contradict each other. One puts manufacturing at 40 to 50 days, another at 58, another at 45 to 65.
They disagree because they measure different things:
- Different populations. Large public companies behave nothing like mid-market firms, and most tables never say which they sampled
- Different denominators. Some derive DSO from total revenue rather than credit sales, which understates the result
- Different methods. Several widely circulated tables are proxies calculated from receivables as a percentage of sales, not reported DSO at all
- Recycled figures. A number gets published once, cited without provenance, and reappears for years after the underlying survey has moved on
Treat any DSO table without a stated source and sample as decoration.
Where to find reliable benchmark data
Three sources are worth actually using:
- The Credit Research Foundation's National Summary of Domestic Trade Receivables. A quarterly survey reporting DSO, Best Possible DSO, CEI, ADD, percent current, and percent over 91 days, broken out by SIC code. Results go to participants, so contributing your own data is the price of entry
- The Dun & Bradstreet and CRF joint quarterly A/R and DSO Industry Report, which extends the same work across roughly 225 industry segments
- APQC's Open Standards Benchmarking for accounts receivable, which reports performance quartiles rather than a single average. CFO.com has published the DSO quartiles from a survey wave of over 5,000 participants
The CRF survey is the closest thing the industry has to a standard, and it measures almost exactly the metric set in this chapter.
How to compare DSO across industries
Raw DSO is a poor cross-industry comparison, because it bundles your payment terms in with your collections performance.
A cleaner comparison divides one by the other:
DSO efficiency ratio = DSO ÷ average payment terms
A business on net 30 collecting in 33 days scores 1.1. A business on net 60 collecting in 66 days scores the same. Both are running about 10% past terms, which the raw numbers of 33 and 66 completely obscure.
That ratio travels across industries in a way DSO never will. Your own trend over time and your gap to Best Possible DSO remain more useful than any external comparison.
Close the gap between your DSO and your best possible DSO
Lunos is built to win that back, with consistent follow-up on every account and promises tracked to the day. Book a demo to see where your collectable slack is hiding.